During early June a large pollution episode occurred in Ontario. The EPA maps below show that low air quality started out in the lower mid-west and appears to move clockwise to the north and then east from June 7-11. Ontario's air troubles peak on June 10, when the US air mass is at its northernmost extension. This is typical of Ontario's worst "bad air days", when the bulk of the smog seems due to US sources.
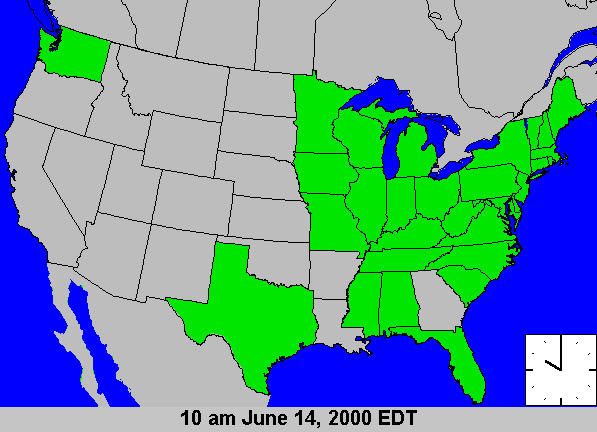
June 14's EPA animation shows an episode of moderate pollution in Ohio, Pennsylvania, and western NY state which very likely was due to Ontario-produced pollutants blown southeast across Lake Ontario. June 14's Ontario map, though colored differently (see ) shows Ontario experiencing poor air quality at this time.
- these GIF movie format maps are available from the EPA at http://www.epa.gov/airnow/ozone.html
- each file is approximately 400K